New Cars vs Used Cars in India: What Five Years of Sales Data Really Says
India sold 5.9 million used cars and 4.3 million new passenger vehicles in FY25. This research guide explains the five-year trend, mature-market comparison, buyer choices and the road to 2030.
The answer in seven points
- Used cars outsold new passenger vehicles in each of the five years studied.
- New-car sales grew faster from FY21 to FY25 because FY21 was a very weak pandemic year for new vehicles.
- Used-car sales grew faster in FY25 itself, about 8% by CRISIL's estimate, while SIAM reported 2% growth for new passenger vehicles.
- The used-to-new ratio did not rise in a straight line. It fell as new-car supply recovered, then moved up again.
- Mature markets such as the US and UK have much higher used-to-new ratios, but that is mainly because they have a deep stock of cars and well-built resale systems.
- A strong used-car market helps new-car sales. Today's new car becomes tomorrow's used-car supply, and a good resale value makes the next upgrade easier.
- India's next growth barrier is trust. Price discovery has improved faster than vehicle history, inspection quality, ownership transfer and used-car finance.
Prefer a quick video version? Watch this short explainer below.
Video explainer: New vs Used Car Sales in India Watch on YouTube New vs Used Car Sales in India explainer
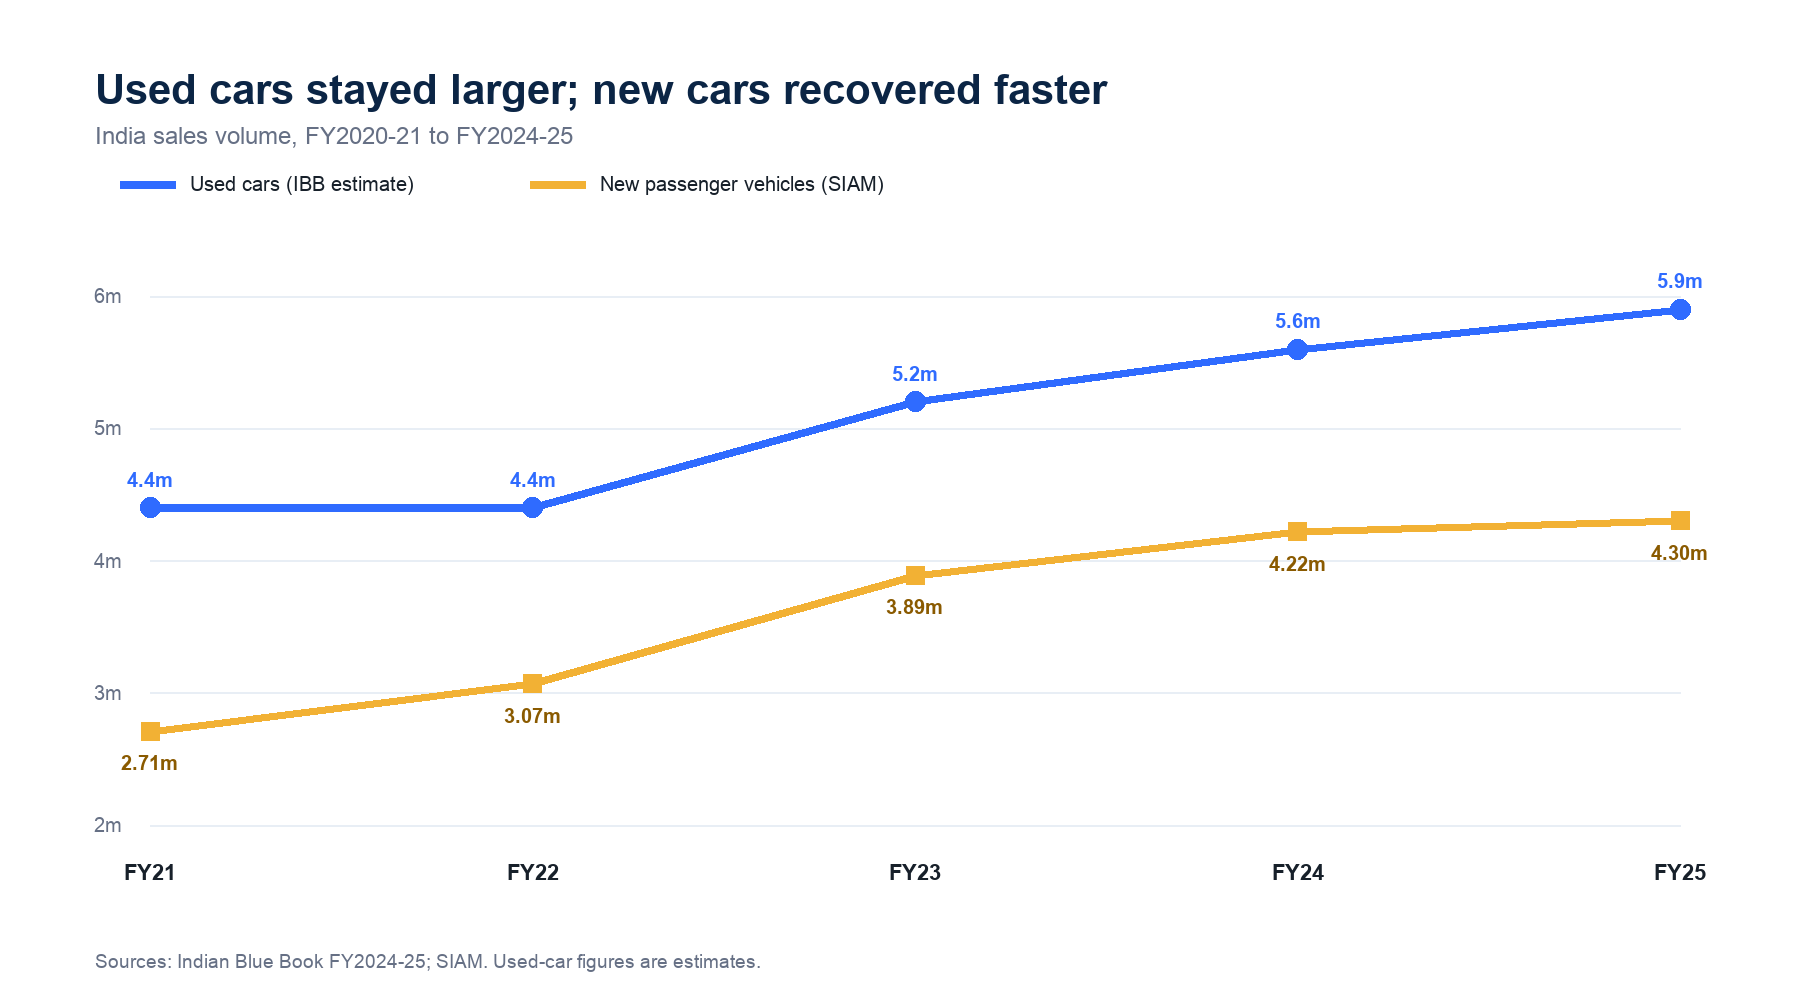
Figure 1. Sales volume in millions. Used-car estimates: Indian Blue Book FY2024-25 historical series. New passenger-vehicle domestic sales: SIAM. FY21 means the financial year ending March 2021.
The five-year numbers
Financial year Used-car sales estimate, million New passenger-vehicle sales, million Used cars per new car What changed FY2020-21 4.4 2.71 1.62 Lockdowns and supply trouble hit new vehicles harder. Personal mobility kept used-car demand alive. FY2021-22 4.4 3.07 1.43 New-car supply began to recover, but chip shortages and long waiting periods remained. FY2022-23 5.2 3.89 1.34 New-car sales rebounded sharply. Used cars also moved beyond their pandemic plateau. FY2023-24 5.6 4.22 1.33 Both markets reached greater scale. Used-car supply improved as owners resumed upgrades. FY2024-25 5.9 4.30 1.37 New-car growth slowed to 2%. Used-car momentum strengthened and the ratio edged upward.Sources and calculation: Used-car volumes are from the Indian Blue Book FY2024-25 report. New passenger-vehicle volumes are from SIAM FY2021-22, SIAM FY2023-24 and SIAM FY2024-25. Ratios are CarArth calculations using unrounded sales values where available.
The table looks simple. The market beneath it was not.
A used car may pass through an owner, a broker, a dealer, an auction and another dealer before a buyer takes the keys. One report may count the retail change of ownership. Another may estimate the whole trade. A third may measure only organised companies. The car is the same. The number is not always the same.
That is why this article treats the figures as a market estimate, not as a national headcount.
What the five-year trend actually shows
1. Used cars were larger, but new cars recovered faster
The latest Indian Blue Book series shows used-car sales rising from 4.4 million in FY21 to 5.9 million in FY25. That works out to about 7.6% annual growth. SIAM's new passenger-vehicle series rose from 2.71 million to 4.30 million, or about 12.2% annual growth.
The faster new-car growth does not mean buyers rejected used cars. FY21 was an unusually low starting point for new vehicles. Factories, showrooms and supply chains were interrupted. As production returned, the new-car line had farther to climb.
The more useful signal sits at the end of the period. CRISIL Ratings estimated that used-car volumes grew about 8% in FY25 and could grow another 8% to 10% in FY26. SIAM recorded only 2% new passenger-vehicle growth in FY25.
In plain language, new cars won the recovery. Used cars entered FY26 with the stronger pace.
2. The used-to-new ratio did not climb neatly
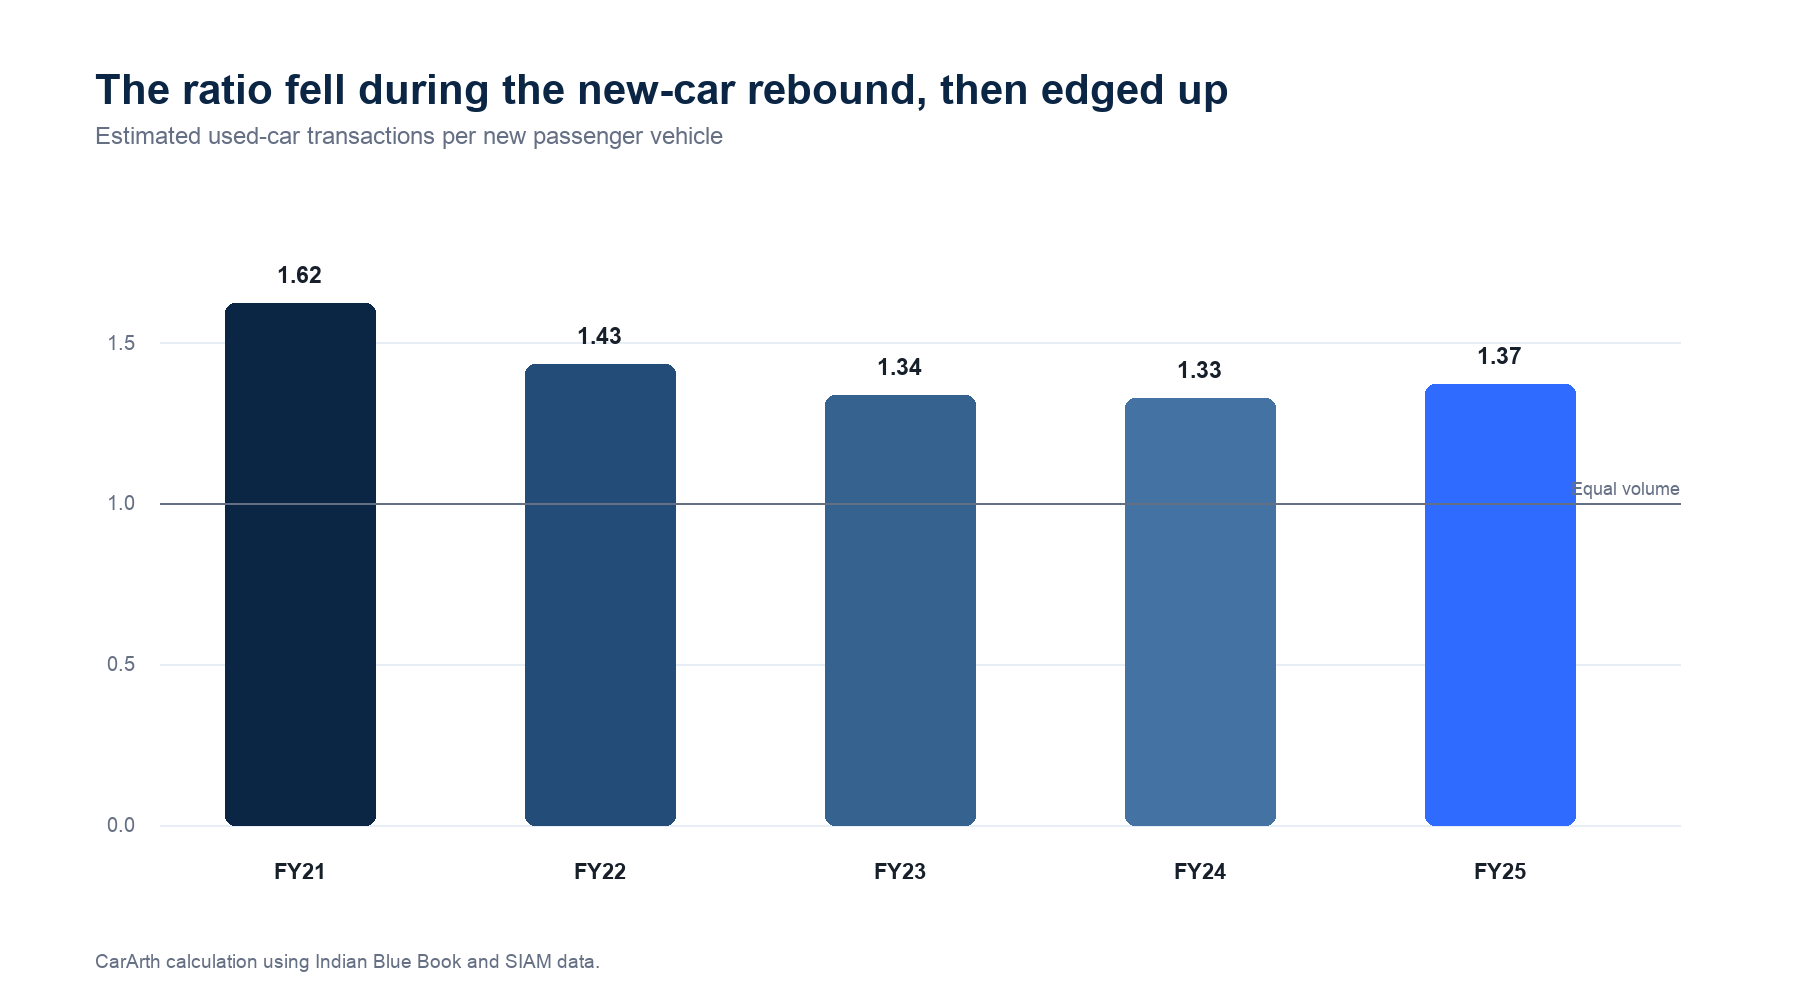
Figure 2. CarArth calculation based on Indian Blue Book used-car estimates and SIAM new passenger-vehicle sales.
The used-to-new ratio was high in FY21 because new-car sales were unusually weak. The ratio then moved closer to 1.3 as new supply returned. It rose to 1.37 in FY25.
This matters because a ratio can move for two reasons. Used-car sales can rise, or new-car sales can fall. Sometimes both happen. A ratio is useful, but it is not a mood survey.
CRISIL's July 2025 note says the ratio improved to about 1.4 from below 1.0 five years earlier. The latest Indian Blue Book historical series shows used cars already ahead of new cars during that period. The two claims cannot be placed on one clean line without the underlying definitions and earlier revisions.
The safe conclusion is narrower: recent, well-cited studies agree that India's used-car market is now about 1.3 to 1.4 times the new-car market by volume. Claims about the exact path should name the source and method.
3. Used cars became more aspirational, and more expensive
The used-car buyer is not simply looking for the cheapest running car. The Indian Blue Book FY25 survey reports that SUVs and compact SUVs accounted for 56% of buyer preference in FY25, up from 23% in FY21. The same report puts the average used-car selling price at about Rs 5.45 lakh, 36% above FY21.
That does not make used cars cheap. It makes them a cheaper entry into the car or segment a buyer already wants.
A buyer who cannot stretch to a new compact SUV may not return to a new hatchback. The buyer may choose a four-year-old SUV instead. The badge, body style and features survive depreciation rather well. The first owner's bill does not.
4. Finance is entering the used-car purchase
The Indian Blue Book reports finance penetration rising from 13% in FY21 to 32% in FY25. The report expects it to reach 40% by 2030.
This is progress, though the used-car loan is still a less tidy product than a new-car loan. The vehicle is older, its value is harder to fix, and its condition can change the lender's risk. Interest rates are often higher. Loan periods may be shorter.
Better finance will expand the market only when valuation and inspection improve with it. Easy credit against a badly checked car is not buyer protection. It is a longer problem paid in monthly instalments.
5. Organised retail is growing, but most of the market remains scattered
The Indian Blue Book puts the organised share at 21% in FY25, up from 18% in FY23. That leaves most transactions with smaller dealers, brokers and direct owner-to-owner sales.
The unorganised market is not automatically dishonest, and the organised market is not automatically perfect. The real difference is repeatable process. Written inspection reports, ownership checks, standard warranties, finance, return rules and accountable paperwork are easier to demand from a system than from a handshake.
India has no shortage of handshakes. It has fewer clean service records.
Did mature markets move from new cars to used cars?
Only partly. Mature markets did not recently turn their backs on new cars. Used-car sales became large over decades because millions of earlier new cars built a deep and varied vehicle stock.
Economists sometimes call that stock the vehicle parc. It simply means all the cars already on the road. When the parc is large, more owners can sell, exchange, lease-return or trade in a car each year. Used supply becomes steady. Lenders understand residual values. Dealers can inspect and price cars with more confidence. Buyers see more choice.
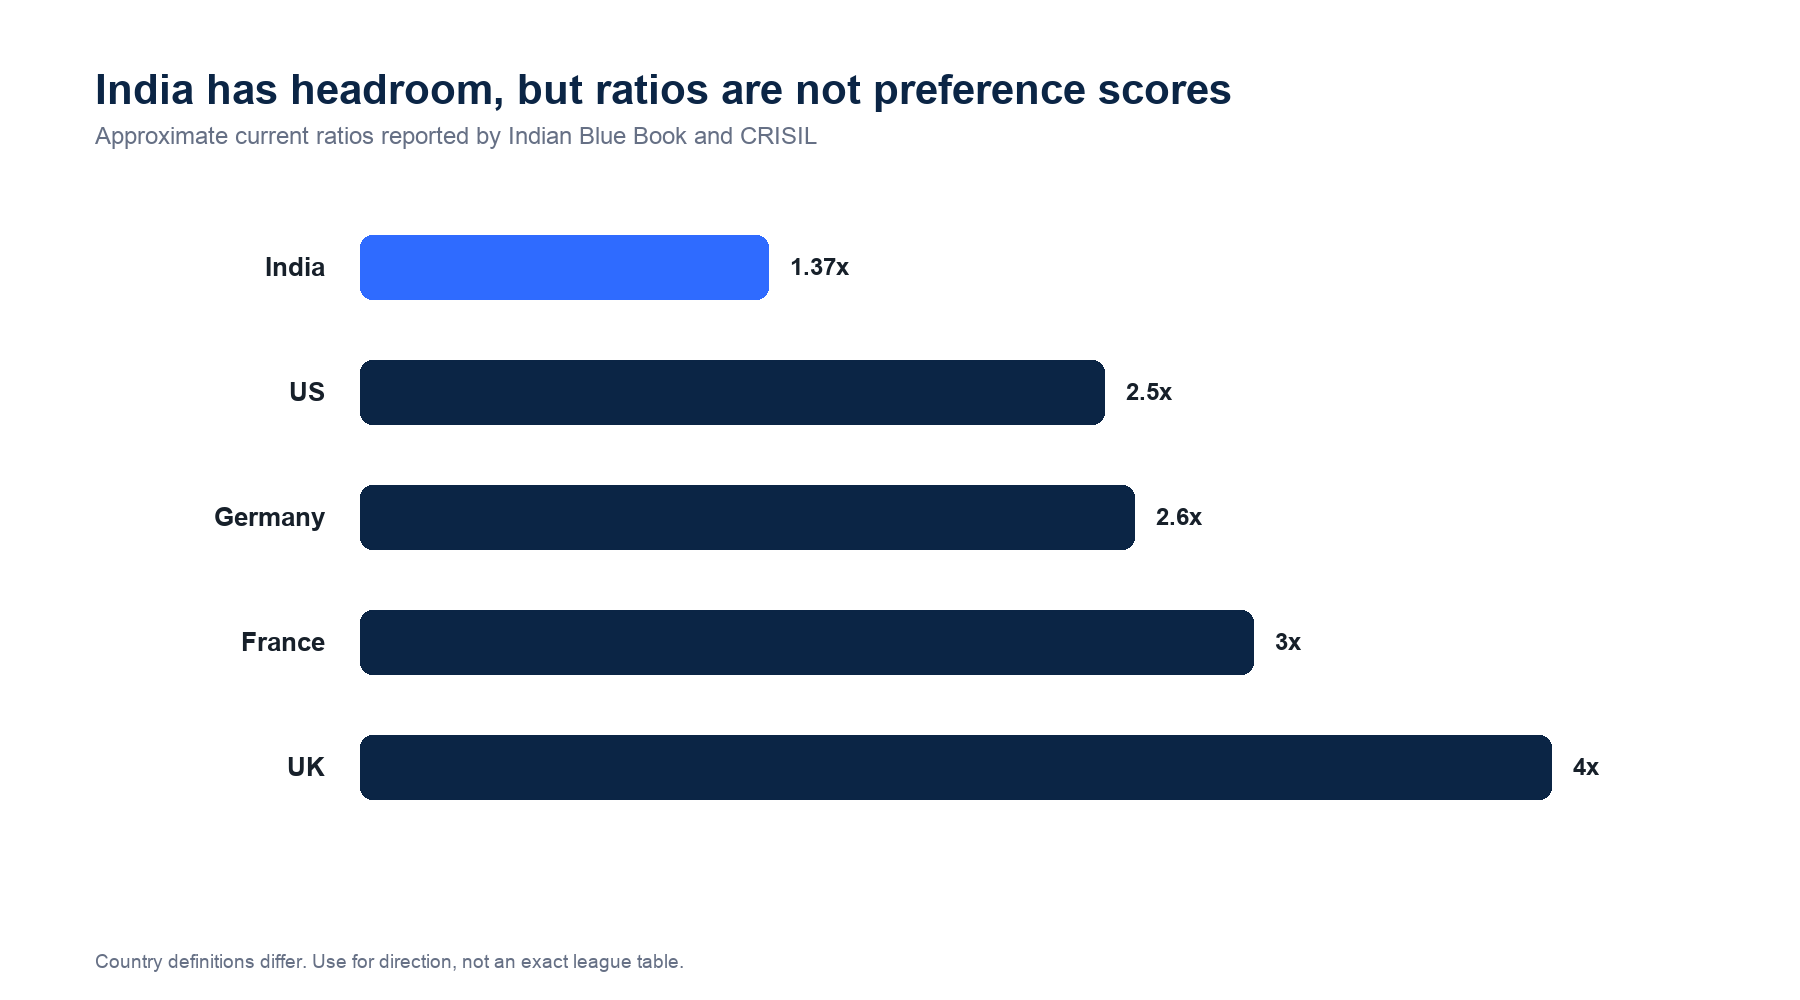
Figure 3. Approximate used-to-new sales ratios reported in the Indian Blue Book FY2024-25 and CRISIL Ratings: India 1.37, US 2.5, UK 4.0, Germany 2.6 and France 3.0. Definitions differ by country, so the chart is directional.
The US: used-heavy before and after the pandemic
NADA reported 17.1 million new light-vehicle sales in 2019 and expected used sales to remain near 39.5 million. That was roughly 2.3 used vehicles for every new one.
For 2024, Cox Automotive forecast 36.2 million used-vehicle sales, while NADA reported 15.85 million new light vehicles. The ratio was again about 2.3.
The US did not shift sharply from new to used during those five years. It remained a used-heavy market. New cars were expensive, but the deeper reason was supply: a vast fleet, lease returns, trade-ins, dealer auctions, vehicle-history systems and long-established finance.
The UK: a higher ratio without higher used volume
The Society of Motor Manufacturers and Traders counted 7.94 million used-car transactions in 2019. The UK registered 2.31 million new cars that year, giving a ratio of about 3.4.
In 2024, the UK recorded 7.64 million used transactions and 1.95 million new registrations. The ratio rose to about 3.9.
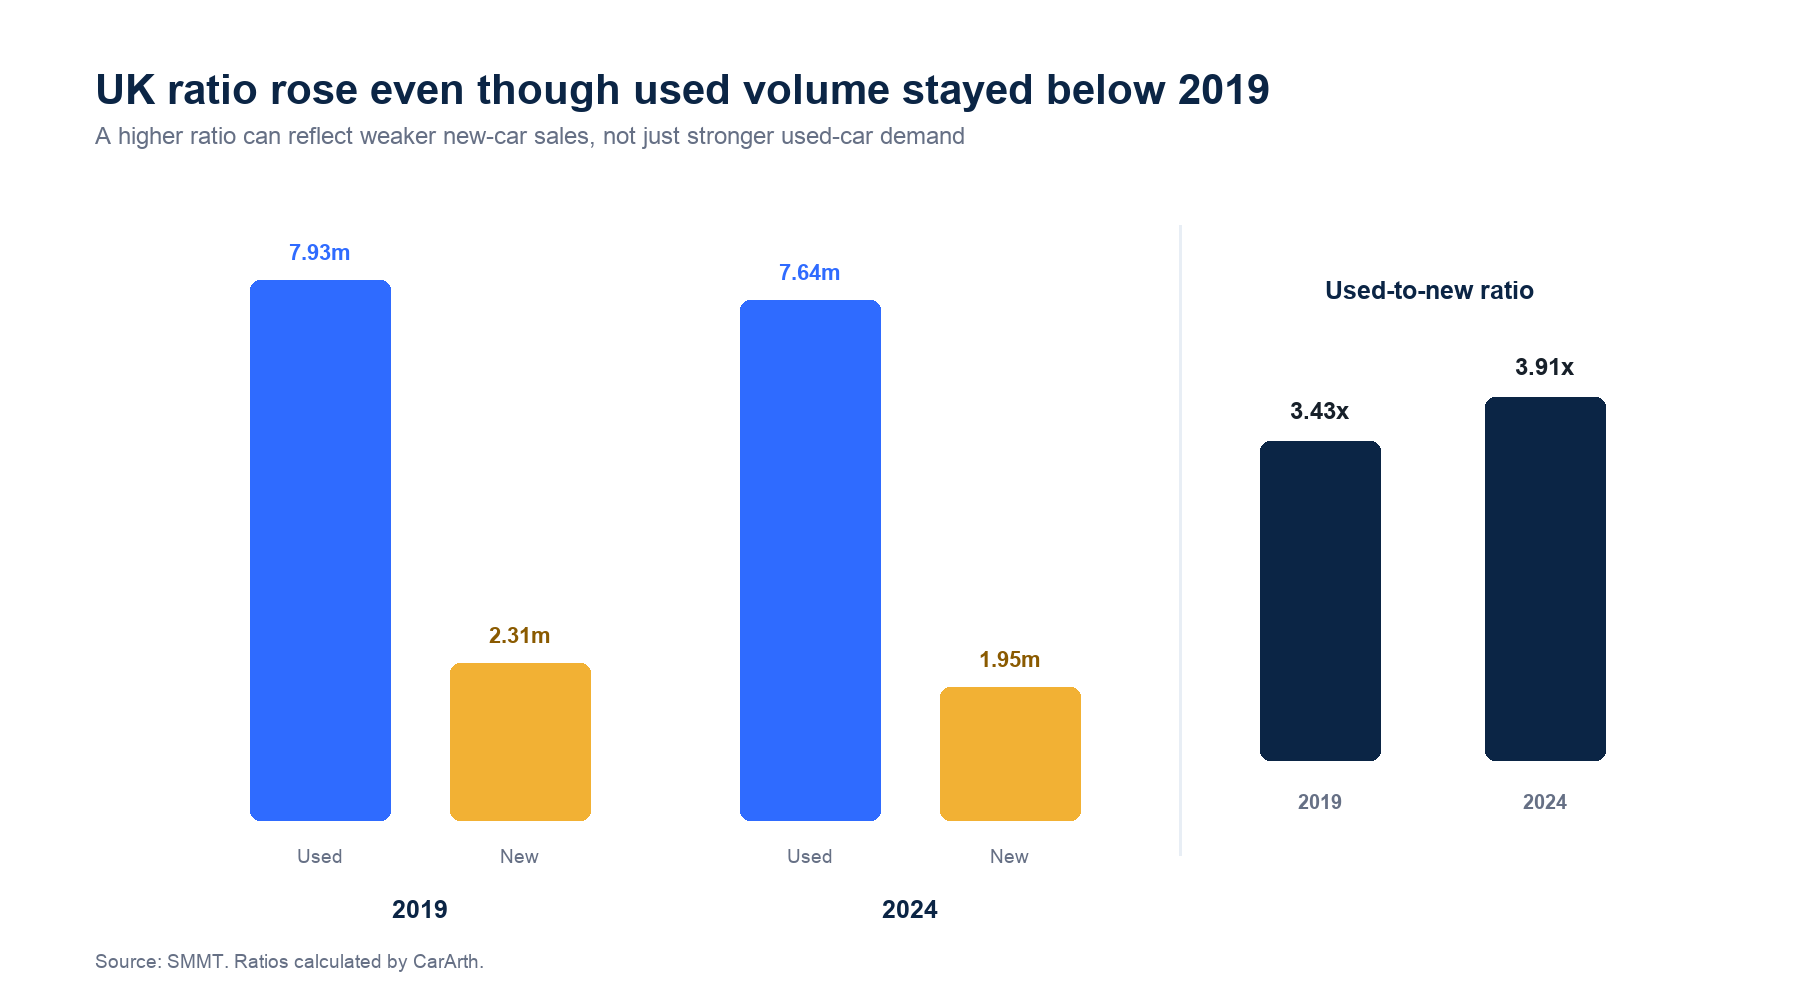
Figure 4. SMMT data; ratio calculated by CarArth. This example shows why a higher ratio does not always mean a rush away from new cars.
Used volume in 2024 was still below 2019. The ratio rose because new registrations fell further. The arithmetic looks like a stronger preference for old cars. The full table tells a calmer story.
What mature markets teach India
Mature markets offer six useful lessons:
- New-car sales create future used-car supply. A healthy used market needs a healthy flow of new cars several years earlier.
- Trade-ins shorten the ownership cycle. A buyer upgrades sooner when the old car has a clear value and a quick exit.
- Residual-value data supports finance. Lenders can price risk better when model-level resale data is deep and consistent.
- Vehicle history lowers fear. Accident, title, mileage and service information reduce the amount of blind trust in a deal.
- Independent inspection matters. Certification should describe the car, not merely decorate the listing.
- End-of-life rules protect the market. Unsafe cars should leave the road instead of returning through another cheap sale.
India is moving along this path, but not in a straight copy of the West. Indian cars are often kept longer, family advice has more weight, service records are uneven, and ownership transfer can still require patience. We have digitised the advertisement faster than the car's life story.
What India's numbers signify
India is entering the circulation stage of car ownership
For years, the main question was how many Indian households could buy their first new car. That question still matters. Another one has arrived beside it: how easily can an existing car move to its second or third owner?
The growth of used sales shows that cars are circulating through the economy more often. Faster circulation releases value for the seller, creates lower-cost access for the buyer and brings the original owner back into the new-car market.
This is why the two markets should not be treated as opponents.
The used-car market is becoming a mobility ladder
Used cars now serve several buyers at once:
- A first-time buyer seeking safer family travel.
- A two-wheeler household moving to four wheels.
- A city commuter who wants an automatic without paying the full new-car price.
- A small-business owner who needs dependable transport.
- A buyer choosing a larger or safer car within a fixed budget.
- An enthusiast looking for a discontinued engine, gearbox or body style.
The same car can help one owner upgrade and another owner enter the market. Very few consumer goods have such an active second life.
Trust is now the limiting factor
Demand is visible. The weak spots are also familiar:
- Odometer readings may not match the car's real use.
- Service records may be incomplete or available only inside one workshop network.
- Accident and flood repairs can be hard to trace.
- A loan, challan or ownership-transfer issue may appear late.
- Inspection reports may use different standards.
- Warranty terms may sound wider than the parts they cover.
- Asking prices may be mistaken for transaction prices.
A buyer can compare twenty listings before lunch and still not know whether one odometer is honest. Discovery became digital first. Proof is catching up.
New car or used car: the practical decision
Buyer need New car usually fits better Used car usually fits better Check before deciding Lowest repair uncertainty Full warranty and known history Only if inspected and covered well Warranty exclusions and service schedule Lowest purchase price Entry model may fit Larger or higher trim for the same budget Repair reserve, insurance and loan rate Latest safety and emissions technology Strong advantage Available in newer used cars Exact variant, build date and safety equipment Immediate delivery Depends on stock and waiting period Often available sooner RC status and delivery paperwork Five-to-eight-year ownership Known starting point helps Strong if bought at the right age and condition Total cost, not only purchase price Frequent upgrades First depreciation hit is larger Lower entry cost can help Resale demand for that model EV purchase New warranty reduces battery risk Price can be attractive, but data is thin Battery health, warranty transfer and charging history Rare or discontinued model Usually unavailable Main route to ownership Parts supply and specialist supportSeven costs buyers often forget
The sticker price settles only the first argument. Compare these seven costs:
- Down payment and loan interest.
- Registration, tax and transfer charges.
- Insurance premium and claim history.
- Fuel or electricity.
- Scheduled service and likely repairs.
- Tyres, battery and wear items due soon.
- Expected resale value at the planned exit year.
A used car that needs tyres, suspension work and a major service can lose its price advantage quickly. A new car bought with a large loan can lose more through interest and early depreciation. The cheaper car is the one that costs less over the years you will keep it.
The way forward for India's used-car market
1. Build a usable vehicle-history layer
India has useful records across registration, pollution checks, insurance, workshops, lenders and service networks. The buyer rarely sees them as one clean history.
The next step is permission-based data sharing that can show ownership events, mileage signals, major claims, theft status, finance closure and service gaps without exposing personal data. One source will not be enough. Fraud often appears in the mismatch between sources.
2. Make inspections comparable
An inspection should state what was checked, how it was checked, what could not be checked and how long the result remains valid.
India needs common terms for structural damage, flood exposure, paintwork, engine health, diagnostic faults, tyre life and roadworthiness. A 200-point inspection is not useful merely because 200 sounds diligent. The buyer needs to know which failed points can become a bill.
3. Link finance to the car's condition and future value
Used-car finance can grow without copying new-car lending. The loan should consider vehicle age, verified condition, model reliability, expected resale value and remaining useful life.
Better risk data can narrow the interest-rate gap for good cars. It can also prevent long loans on cars that will be difficult to sell before the final EMI.
4. Treat ownership transfer as part of the sale
A sale is not complete when the car and money change hands. The registration must change too.
Platforms and dealers should track transfer until closure, give both parties dated proof, and flag open challans, hypothecation and state-level requirements before payment. The seller should not discover months later that the old car is still collecting fines in the old name.
5. Publish real transaction ranges
Listings show expectation. Transactions show the market.
Model, variant, age, city, mileage, condition, ownership count and service history should feed a price range with a confidence level. A single neat valuation can be comforting and wrong. A range shows the buyer where judgement still matters.
6. Prepare for the used-EV question now
India's used-EV market is still small, but new EV sales are creating future supply. The resale market will need battery state-of-health tests, warranty-transfer rules, repair-cost data and clear information on software and charging compatibility.
The UK example is useful. SMMT data shows used battery-electric transactions rising as more new EVs reached the second-hand market. Used EV demand cannot grow far ahead of used EV supply. India's EV resale market will be built by the new EVs sold today and the battery records kept from their first day.
7. Remove unsafe end-of-life cars from circulation
A mature used market does not keep every old vehicle alive. It keeps good vehicles moving and retires unfit ones.
India's Registered Vehicle Scrapping Facility service provides an authorised route and a Certificate of Deposit for eligible incentives. The harder work is consistent fitness testing, convenient scrapping access and a clean link between scrapping and registration records.
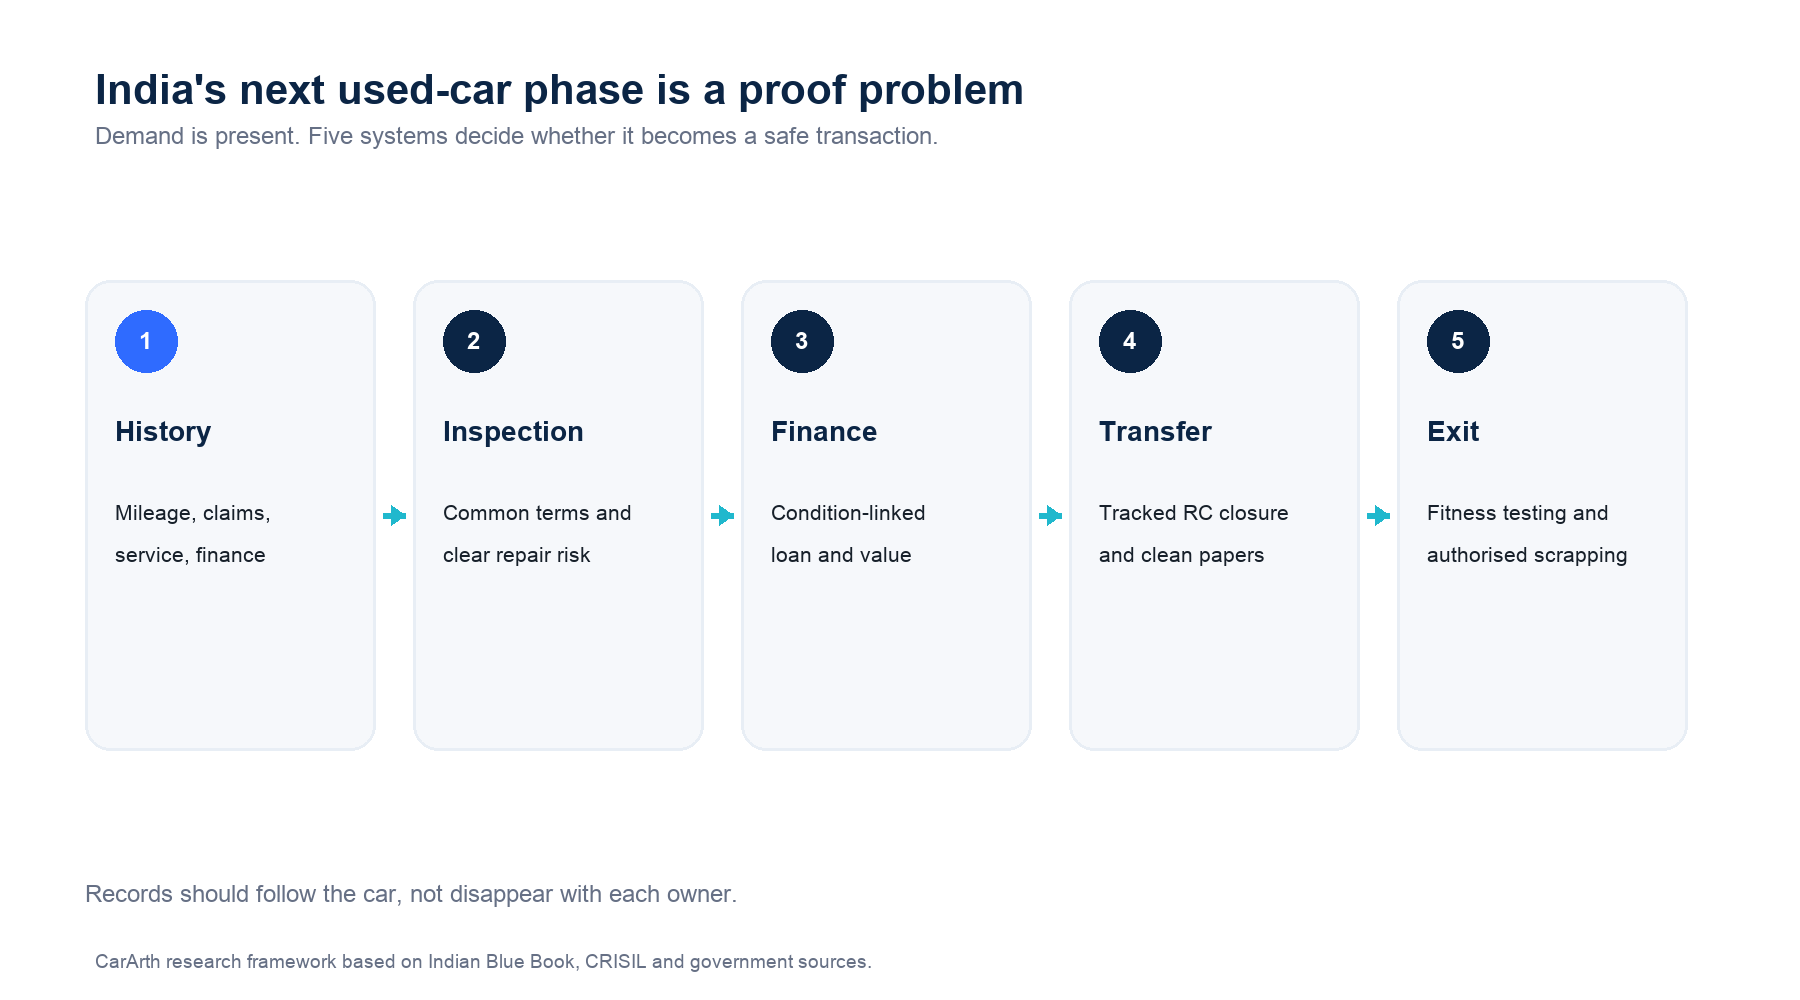
Figure 5. CarArth research framework based on the gaps identified across Indian Blue Book, CRISIL and government sources.
What happens by 2030?
Published forecasts agree on the direction and differ on the size.
Source Base year Used-car forecast New-car forecast or ratio What to remember Indian Blue Book FY25 FY25: 5.9 million 9.5 million by FY30 Used-to-new ratio of 1.9 Full industry estimate; 10% used-car CAGR CARS24 and Team-BHP 2024 report CY23: 4.6 million 10.8 million by CY30 6.3 million new cars; ratio 1.7 Company-led research using a different base and calendar years CRISIL Ratings, July 2025 FY25 estimate below IBB Above 6 million in FY26 Ratio about 1.4 at publication Strong near-term view; focuses on industry credit and organised companiesSources: Indian Blue Book FY2024-25, CARS24 and Team-BHP 2024 report, and CRISIL Ratings.
A sensible planning range is 9.5 million to 10.8 million used-car sales around 2030, not one guaranteed number. The lower end still implies a much bigger market than FY25. The upper end requires strong supply, wider finance and more confidence in condition and records.
New-car demand is not expected to disappear. SIAM reported a record 4.64 million domestic passenger vehicles in FY26. ICRA expects further new passenger-vehicle growth to continue at a more moderate pace in FY27.
The likely future is not new versus used. It is a faster ownership cycle linking both.
Seven findings for researchers, journalists and industry teams
- India's used market is larger by volume, but its historical size is still estimated. Quote the source beside the number.
- FY21 is a poor normal-year base. Pandemic disruption makes five-year growth rates look cleaner than the market felt.
- The used-to-new ratio is not a direct measure of preference. It changes when either side of the fraction changes.
- Mature-market ratios reflect the size of the vehicle stock. They are not proof that buyers stopped wanting new cars.
- New and used markets feed each other. New sales create supply; resale value supports the next new purchase.
- India's strongest growth gap is institutional. Records, inspection, finance and transfer have more room to improve than online discovery.
- A bigger used market needs a better exit system. Good cars should circulate. Unsafe cars should not.
Methodology
Period
The core comparison covers FY2020-21 to FY2024-25, the latest five-year period for which the selected Indian Blue Book series and final SIAM figures overlap. FY2025-26 is presented separately as a current checkpoint because SIAM has final new-car data while the used-car figure available during research was still a market estimate or forecast.
Definitions
- New car: A domestically sold passenger vehicle in SIAM's passenger-vehicle category, including passenger cars, utility vehicles and vans.
- Used car: A passenger car changing hands in the secondary market, as estimated by the cited industry source.
- Used-to-new ratio: Estimated used-car transactions divided by new passenger-vehicle sales for the same financial year.
- CAGR: Compound annual growth rate. It shows the smooth yearly growth needed to move from the first value to the last. Real yearly growth was not smooth.
Source hierarchy
- Official or trade-body sales data: SIAM, SMMT and government portals.
- Original industry research: Indian Blue Book, CRISIL Ratings, NADA and Cox Automotive.
- Company datasets: CARS24 and Team-BHP, used when the sample and period are identified.
- Reputable business reporting, used mainly to check older figures or report access.
Important limitations
- Used-car volumes are estimates and may be revised in later editions.
- Some sources use financial years and others use calendar years.
- Country ratios may count different vehicle classes and transaction types.
- A used vehicle can change hands more than once in its life, so transactions are not the same as unique vehicles.
- Used-car market value cannot be compared with new-car market value from unit counts alone.
- Forecasts describe assumptions, not promised outcomes.
Update log template
Field Current entry Next update action Research cut-off 4 July 2026 Replace on every material data refresh Core India period FY21-FY25 Roll forward after final FY26 used-car report Latest new-car checkpoint FY26 SIAM: 4.64 million Update after FY27 SIAM release Latest used-car checkpoint FY26 expected above 6 million Replace forecast with final measured estimate Mature-market comparison US and UK through 2024 Refresh with matching full-year datasets 2030 outlook 9.5-10.8 million published range Recalculate when source forecasts changePrefer a brief whitepaper version? Read the neat SlideShare whitepaper or Download the PDF.
References
- Society of Indian Automobile Manufacturers. Annual Report 2021-22.
- Society of Indian Automobile Manufacturers. Annual Report 2023-24.
- Society of Indian Automobile Manufacturers. FY2024-25 sales performance, 15 April 2025.
- Society of Indian Automobile Manufacturers. FY2025-26 sales performance, 14 April 2026.
- Indian Blue Book, Mahindra First Choice and Volkswagen Certified Pre-Owned. Used Car Industry Report FY2024-25, seventh edition.
- CRISIL Ratings. Used-car volume to grow 8-10%, over twice as fast as new one, 11 July 2025.
- CARS24 and Team-BHP. The 2024 Indian Used Car Market Report, January 2025.
- Society of Motor Manufacturers and Traders. UK used car sales data.
- Society of Motor Manufacturers and Traders. UK used car market holds steady in 2019, 12 February 2020.
- Society of Motor Manufacturers and Traders. UK used car market grows in 2024, 11 February 2025.
- Society of Motor Manufacturers and Traders. UK new-car registrations in 2019, 6 January 2020.
- Society of Motor Manufacturers and Traders. UK new-car registrations in 2024, 6 January 2025.
- National Automobile Dealers Association. Analysis of 2019 US auto sales, 8 January 2020.
- National Automobile Dealers Association. 2024 US new light-vehicle sales, 31 December 2024.
- Cox Automotive. Used-vehicle sales and 2024 outlook, 20 March 2024.
- ICRA. Passenger-vehicle growth expected to moderate in FY2027, 27 April 2026.
- National Government Services Portal. Registered Vehicle Scrapping Facility service, updated 6 May 2026.
Related Reading
- Explore all Throttle Talk guides and insights
- Best Used Car Platforms in India (2026): Platform Types, Fee Models, Inspection Claims & Buyer Stack
- CARS24 vs Spinny: Better for Buying or Selling? (2026)
- OdoShield vs Cars24 Odometer Tampering Check: Which Tool Better Protects Used Car Buyers in India? (2026)
- Learn how CarArth OdoShield checks odometer fraud
- Browse used cars in Hyderabad on CarArth